Built an interactive 2-page operations dashboard to monitor
delivery and pickup performance across 25 agent areas in Indonesia.
Features TTD ontime rate KPIs with period-over-period comparison,
top outlet late delivery rankings, problem package breakdown,
and HUB clearance delay analysis.
Built with Python, Streamlit, Plotly, Pandas, and SQLite.

In this task, I did Data Cleaning, EDA on the given raw dataset
and made some visualizations by using Google Spreadsheet.

The task was to do an A/B Testing analysis based on the ecommerce company landing page
that has been divided to two groups, which is old page (control group) and new page (treatment group) with
a purpose to determine whether the new page will give better conversion rate before rolling out to a wider audience.

Created queries in Google BigQuery platform to find the average amount of duration, total trips,
total bikes, youngest and oldest age of the members, latest departure trips etc and
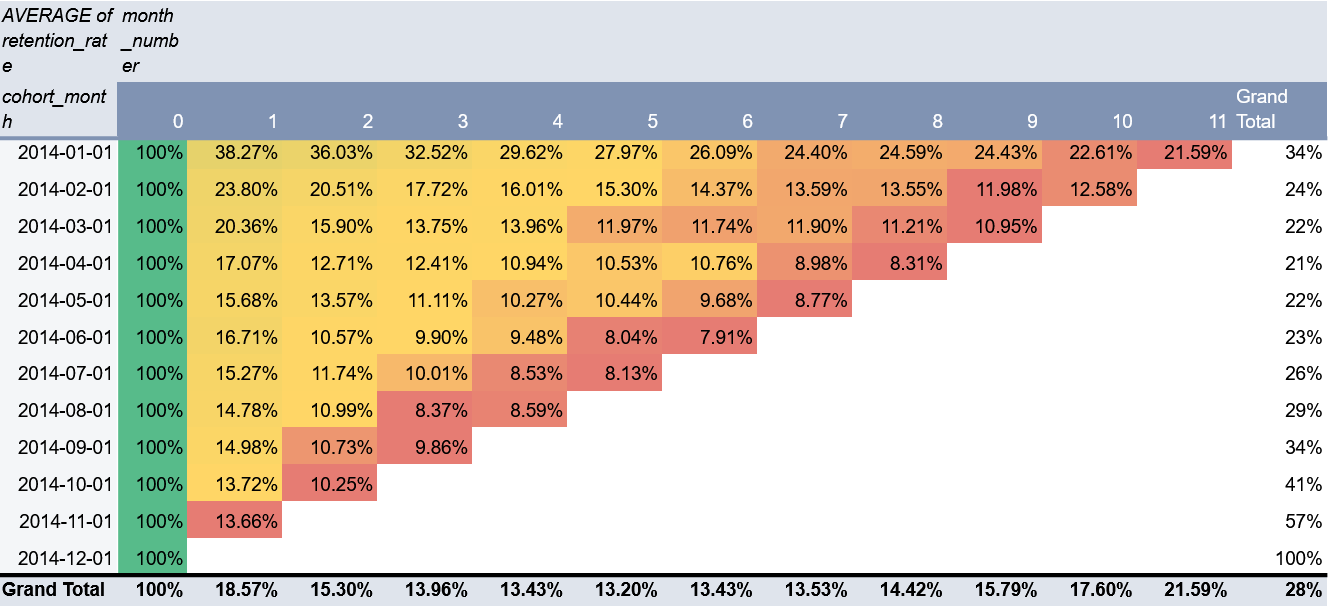
made a cohort analysis to calculate the monthly retention based on the date of
the user/author posted their stories.
Created a customer segmentation based on the customer's recency, frequency,
monetary pattern analysis in ecommerce dataset.

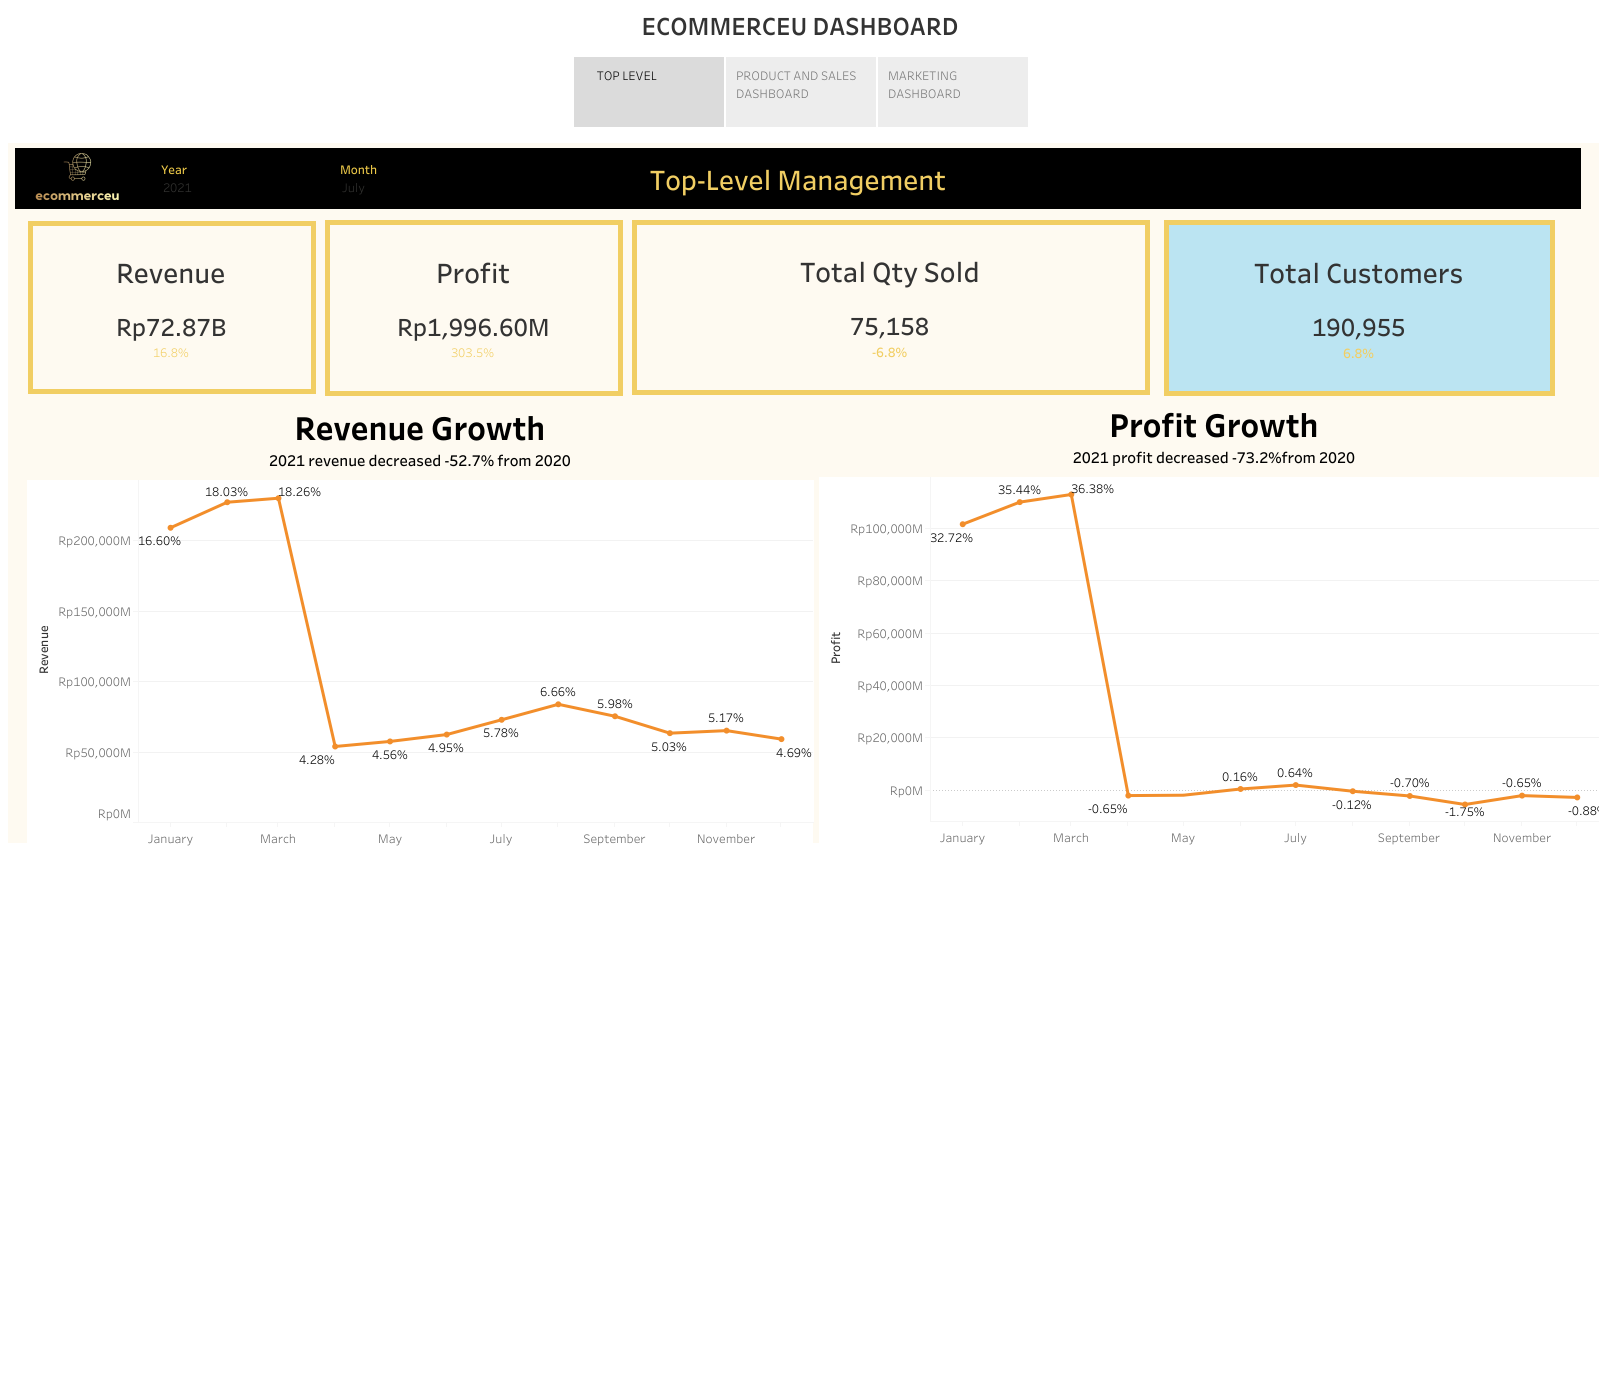
Made an operation Dashboard for top level, product & sales, marketing division
to ease the monitoring of important metrics, e.g: revenue/profit growth, convertion rate, total transactions etc.